Tracking Usage Metrics for SaaS Product Improvement
Enhancing your SaaS product requires more than just an understanding of customer interactions; it demands precise tracking and analysis of usage metrics. Key metrics such as Product Activation Rate and Customer Engagement Score are essential for identifying user satisfaction drivers. However, the challenge lies in effectively analyzing this data to foster continuous improvement and ensure long-term success.
Let's delve into the intricacies of this critical process.
Importance of Usage Metrics
Tracking usage metrics is essential for understanding customer interactions with your SaaS product. These insights help identify valuable features and areas needing improvement, thereby enhancing user engagement and refining the onboarding process.
Key metrics to monitor include:
- Product Activation Rate: Measures the percentage of users who complete initial setup or onboarding steps. Higher rates indicate effective onboarding processes.
- Time to Value: Assesses the duration it takes for users to realize the product's value. Shorter times generally lead to higher user satisfaction and retention.
- Customer Engagement Score (CES): Quantifies user interaction frequency with the product. A higher CES correlates with increased satisfaction and sustained usage.
- Feature Adoption Rate: Tracks the uptake of specific features, guiding development priorities based on user preferences.
- Product Stickiness: Evaluated using the DAU/MAU ratio, this metric helps develop retention strategies by indicating how regularly users return to the product.
Understanding these patterns is crucial for reducing churn rate and fostering a loyal customer base.
Key Metrics for Product Management
Understanding key metrics for product management is essential for making informed decisions that drive your product's success and enhance user experience. These metrics allow you to measure user engagement, improve retention rates, and refine your product based on actual user behavior.
Here are five crucial metrics to track:
- Product Adoption Rate: This measures the percentage of users who reach significant milestones, indicating the overall acceptance and integration of the product.
- Time to Value: This metric reflects the speed at which customers perceive value from the product, with shorter times correlating to higher retention rates.
- Customer Engagement Score: This quantifies the level of user engagement, where higher scores indicate increased satisfaction and loyalty.
- Feature Usage: This tracks the frequency of specific features being utilized, providing insights to guide product development in alignment with user needs.
Customer Acquisition Metrics

Customer acquisition metrics are essential for evaluating the effectiveness of marketing strategies and optimizing the journey from prospects to loyal customers. One key metric is the Trial-Customer Conversion Rate, which measures the percentage of trial users who become paying customers. Understanding user behavior during trials is crucial for improving these conversion rates. By analyzing onboarding processes and customer interactions, you can identify areas for enhancement.
Another vital metric is Customer Acquisition Cost (CAC), calculated by dividing total sales and marketing expenses by the number of new customers acquired. This metric ensures that your spending is efficient in attracting new users.
Additionally, the traffic-to-lead rate indicates the effectiveness of your inbound marketing strategies. A higher traffic-to-lead rate suggests successful lead generation, while high conversion rates indicate effective onboarding and user satisfaction.
Customer Retention Metrics
Measuring customer retention metrics is essential for assessing how effectively your SaaS product keeps users engaged and satisfied post-acquisition. A high customer retention rate signifies successful onboarding and engagement efforts, resulting in enhanced customer satisfaction and reduced churn. These elements significantly influence your Monthly Recurring Revenue (MRR) and overall growth.
To gain a deeper understanding of customer retention, focus on these key metrics:
- Customer Retention Rate: The percentage of users who continue their subscriptions over a specific period.
- Customer Churn Rate: The percentage of customers who discontinue their subscriptions within a given timeframe.
- Net Promoter Score (NPS): Measures user satisfaction and loyalty by their likelihood to recommend your product.
- Cohort Analysis: Tracks retention trends among specific user groups over time.
Engagement Metrics for Users

Engagement metrics reveal how frequently users interact with your SaaS product, offering insights into user interest and areas needing improvement. Critical metrics like Daily Active Users (DAU) and the Product Activation Rate illustrate user engagement levels and the effectiveness of your onboarding process. Tracking the completion of essential tasks can help you refine onboarding and boost activation rates.
Another vital metric is Time in the App, which indicates how long users spend on your platform. Longer durations usually correlate with higher satisfaction and improved retention. Feature Usage metrics provide insights into which functionalities are most popular, guiding your development priorities to enhance product value.
The Customer Engagement Score (CES) quantifies user engagement, showing how committed users are to your product. Higher scores are often associated with reduced churn and better retention, as engaged users are less likely to leave.
Feedback and Satisfaction Metrics
To enhance user experience effectively, it's essential to measure user loyalty using robust feedback and satisfaction metrics. Tools such as Net Promoter Score (NPS) and Customer Satisfaction Score (CSAT) provide clear insights into customer perceptions of your product.
Measuring User Loyalty
Understanding user loyalty hinges on effectively utilizing feedback and satisfaction metrics like Net Promoter Score (NPS) and Customer Satisfaction Score (CSAT) to pinpoint areas for improvement. By measuring these scores, you can gain valuable insights into user loyalty and overall contentment.
To enhance your approach:
- Use NPS to gauge the likelihood of users recommending your product.
- Gather CSAT data through brief surveys to assess user satisfaction.
- Evaluate which features resonate with customers to see which meet their needs effectively.
- Monitor engagement levels by tracking the average feedback response rate.
These metrics provide a comprehensive view of your product's performance. Actively incorporating customer feedback helps you identify specific areas for improvement, ensuring you address user needs effectively.
Understanding customer perceptions strengthens connections and fosters loyalty, ultimately driving long-term success. Prioritizing these metrics allows you to adapt your strategies based on actual user sentiment, leading to improved satisfaction and loyalty.
Enhancing User Experience
Improving user experience hinges on efficiently collecting and analyzing feedback through metrics such as Net Promoter Score (NPS) and Customer Satisfaction Score (CSAT). These metrics help gauge customer loyalty and measure overall satisfaction with your product. Regular feedback loops, like in-app surveys, offer valuable insights into user needs and preferences, facilitating enhancements to the user experience.
Achieving a high feedback response rate is crucial to ensure that the gathered data is representative and actionable. Understanding feature resonance allows you to assess how well your product features align with customer needs. This information is vital for informing your product development process, enabling you to prioritize features based on user sentiment.
Consistently tracking user feedback enables iterative improvements, leading to enhanced user engagement and higher retention rates. By actively seeking and applying user feedback, you can create a more satisfying experience that aligns with customer expectations. This ongoing cycle of gathering insights and refining your offering can significantly boost user loyalty and satisfaction, ensuring your SaaS product remains relevant and valuable in a competitive market.
Revenue Tracking Metrics

For effective revenue tracking in your SaaS business, it's crucial to understand key metrics such as Monthly Recurring Revenue (MRR), Average Revenue Per User (ARPU), and Customer Acquisition Cost (CAC).
These metrics provide a comprehensive view of your financial health and inform strategic decisions for growth. Focusing on these figures enables you to make data-driven choices that propel your business forward.
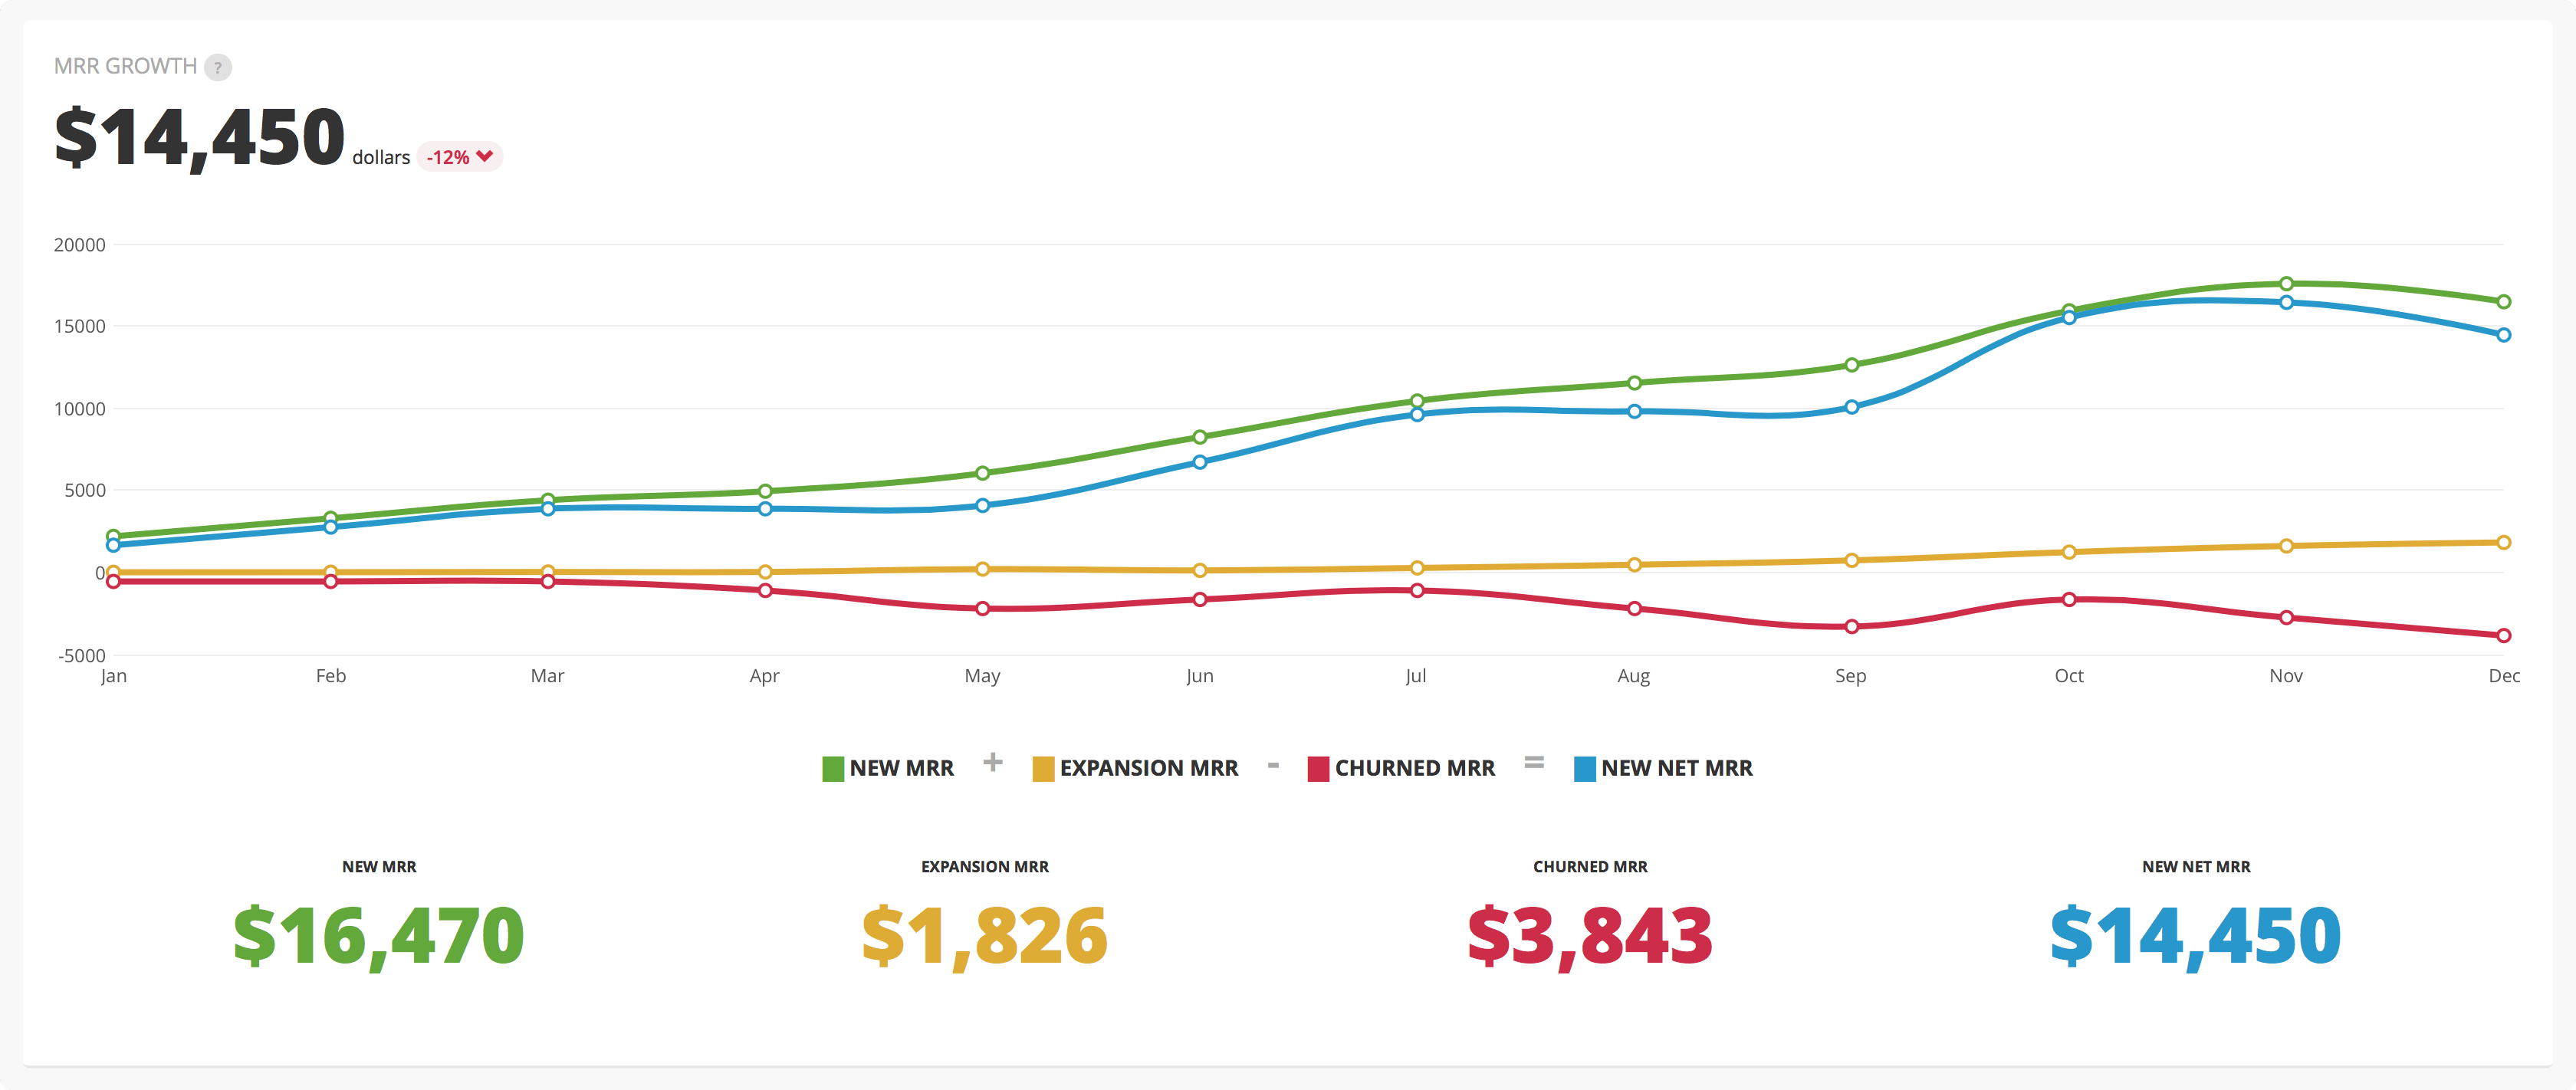
Monthly Recurring Revenue (MRR)
Monthly Recurring Revenue (MRR) is a crucial metric for evaluating the financial health of your SaaS business. It measures predictable, subscription-based income each month, enabling you to forecast future revenue and make data-driven decisions.
Key benefits of monitoring MRR include:
- Revenue growth insights: Understand the impact of customer acquisition, upsells, and cross-sells on your income.
- Customer retention monitoring: Track churn rates and refine strategies to improve retention.
- Impact of marketing campaigns: Assess the effectiveness of marketing efforts on MRR and adjust tactics for better outcomes.
- Seasonality effects: Identify seasonal patterns in MRR to prepare for revenue fluctuations.
A decline in MRR can indicate customer retention issues, prompting a review of your strategies.
Average Revenue Per User
Average Revenue Per User (ARPU) is a vital metric for assessing the revenue-generating efficiency of your SaaS business per customer over a specific period. To calculate ARPU, divide the total revenue by the number of users during that period. This metric offers valuable insights into your financial health and the effectiveness of your pricing strategies.
Tracking ARPU helps you discern trends in user spending, enabling you to refine your product development and marketing strategies. An increasing ARPU generally indicates successful upselling or cross-selling efforts, whereas a decreasing ARPU might suggest a need to reassess your pricing models or user engagement tactics.
Additionally, comparing ARPU with Customer Acquisition Cost (CAC) provides critical insights into profitability. A desirable ARPU to CAC ratio is at least 3:1, indicating that the revenue from each user significantly exceeds the acquisition costs.
Monitoring ARPU not only aids in understanding your revenue efficiency but also in optimizing user experiences to boost spending and loyalty.
Customer Acquisition Cost (CAC)
Understanding Customer Acquisition Cost (CAC) is crucial for evaluating the efficiency of your marketing strategies in acquiring new customers and driving the growth of your SaaS business. By calculating CAC—dividing total sales and marketing expenses by the number of new customers acquired—you can gain valuable insights into your spending efficiency.
Key points to consider for a deeper understanding of CAC include:
- A lower CAC signifies a more effective marketing strategy, leading to higher profitability.
- Strive for a CAC to Customer Lifetime Value (CLTV) ratio of 1:3 to ensure sustainable growth.
- A high CAC relative to CLTV may indicate the need for strategic adjustments in your marketing efforts.
- Monitoring CAC trends over time allows you to evaluate the impact of marketing campaigns and make informed decisions on resource allocation.
Tools for Tracking Metrics
Tracking user metrics effectively is crucial for optimizing your SaaS product and enhancing customer engagement. A variety of analytics tools are available to facilitate the collection and analysis of product usage data, offering a range of functionalities suited to different needs.
Userpilot enables you to track user engagement through in-app experiences without requiring coding skills, making it accessible for non-technical teams. Hotjar provides session recording and heatmaps, which help visualize the user experience and identify high-traffic areas within your application.
Mixpanel specializes in event tracking and allows for user segmentation to understand behavior patterns, which is essential for effective product management. Heap further simplifies this process by automatically capturing every user interaction, eliminating the need for manual event tracking setup.
Additionally, Luzmo integrates with your existing applications to pull real-time user metrics, enhancing product stickiness and informing strategies to reduce churn.
Analyzing and Interpreting Data

Analyzing and interpreting data from user metrics is crucial for making informed decisions that drive your SaaS product's growth and enhance user satisfaction. By focusing on key metrics, you can gain insights that improve user engagement and retention.
Here are some essential aspects to consider:
- Product Activation Rate: Measure the percentage of users reaching key milestones to identify areas for improving engagement strategies.
- Time to Value: Track how quickly users experience benefits; shorter times correlate with higher retention rates and satisfaction.
- Cohort Analysis: Examine specific user groups over time to uncover patterns in engagement, guiding targeted feature enhancements.
- Feature Usage Metrics: Identify which functionalities are most utilized to prioritize development efforts based on user needs.
Strategies for Continuous Improvement
To ensure the continued success of your SaaS product, it's essential to embrace a mindset of continuous improvement. This involves regularly refining features based on user feedback and data insights. Begin by analyzing key metrics, such as onboarding engagement rates, to identify and address bottlenecks in the user experience. Enhancing the onboarding process effectively can significantly improve initial user satisfaction and retention.
Implement user feedback loops using tools like Net Promoter Score (NPS) and Customer Satisfaction Score (CSAT) to gather real-time insights on customer satisfaction. These insights are crucial for guiding product improvements. Additionally, leverage analytics platforms like Usermaven and Mixpanel to monitor feature usage and engagement metrics, ensuring that your product development aligns with user needs and preferences.
Conduct cohort analysis to track user behavior over time, identifying trends that can inform targeted retention strategies and feature enhancements. Focus on continuous iteration, especially for high-usage features, to justify further investments and improvements.
Conclusion
Tracking usage metrics is crucial for the success of your SaaS product. By focusing on key metrics like activation rates and engagement scores, you gain valuable insights into customer behavior and preferences.
This data enables you to refine onboarding processes, enhance features, and boost customer retention. Leverage the available tools and strategies, and commit to continuous improvement. By doing so, you'll foster a loyal user base and drive sustainable growth for your product.
Related posts