Key SaaS Metrics for Growth and Sustainability

Navigating the SaaS landscape requires a deep understanding of key metrics crucial for growth and sustainability. Terms like Customer Acquisition Cost (CAC) and Lifetime Value (LTV) are more than just figures—they interconnect to shape your success.
Monitoring these metrics, along with others such as Monthly Recurring Revenue (MRR), offers valuable insights into your business's health. However, the true power lies in the strategy behind the numbers.
Identifying hidden patterns in your data can drive informed, impactful decisions for your next move.
Understanding SaaS Metrics
To thrive in the competitive SaaS landscape, understanding key metrics is crucial for assessing your business's health and growth potential.
One essential metric is Customer Acquisition Cost (CAC), which measures the expense of acquiring each new customer. This should be paired with Customer Lifetime Value (LTV), indicating the total revenue a customer generates over their relationship with your business. A healthy LTV-to-CAC ratio, ideally around 3:1, suggests sustainable growth.
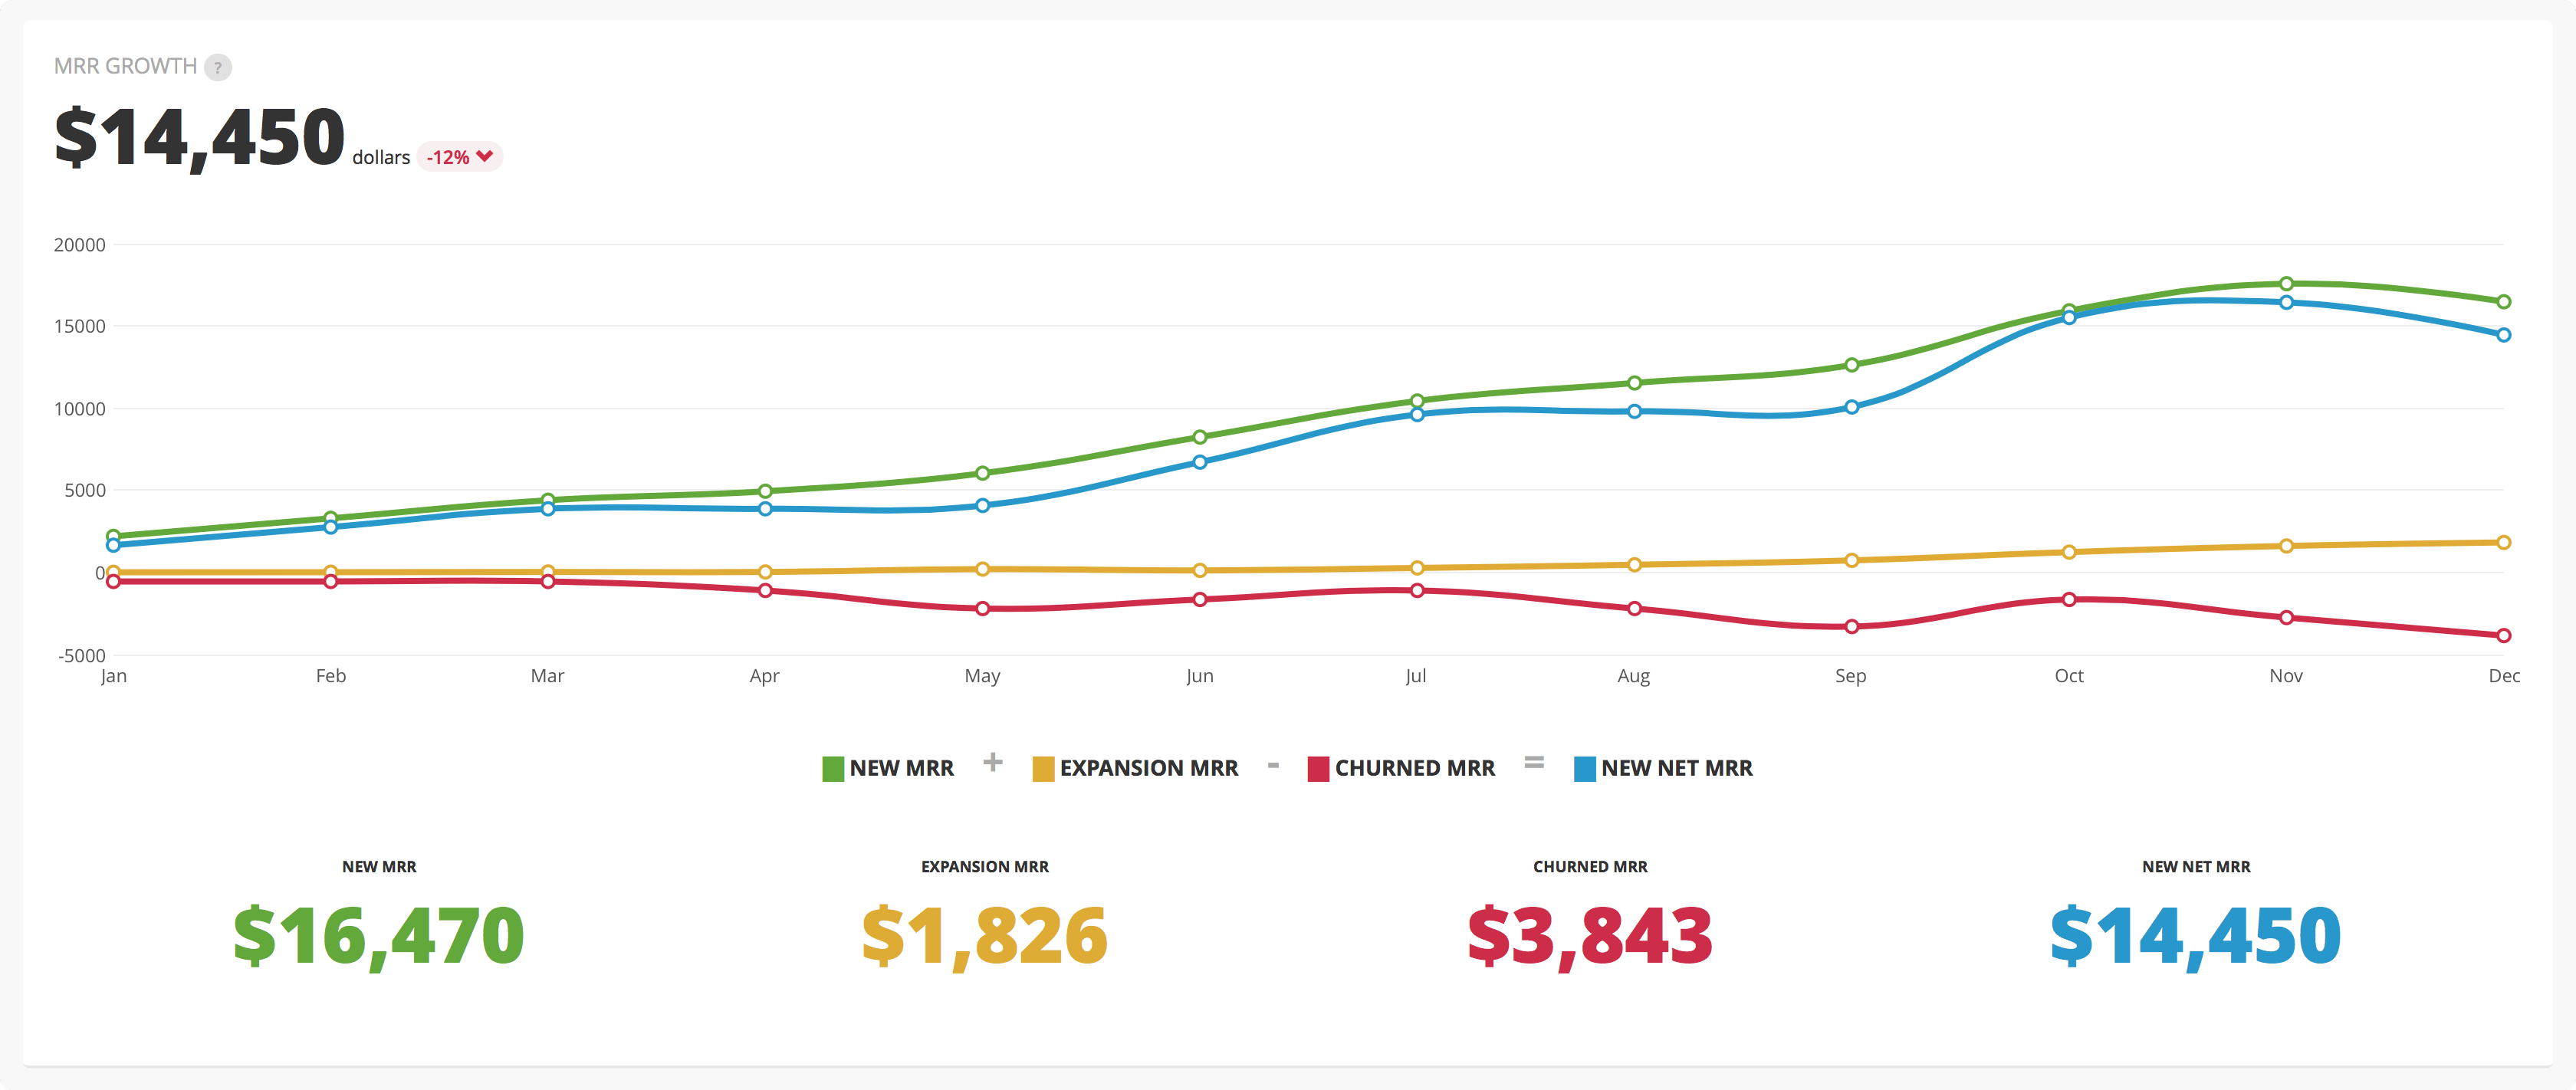
Monthly Recurring Revenue (MRR) is another critical metric, reflecting your predictable income stream. Monitoring churn rates is equally important, as they indicate the percentage of customers who discontinue using your service over a specified period. High churn rates can highlight issues with customer retention.
Additional metrics to track include Activation Rate and Net Promoter Score (NPS). The Activation Rate measures user engagement, while NPS gauges customer satisfaction and loyalty. A high NPS is indicative of strong customer satisfaction, which can lead to enhanced loyalty and long-term revenue retention.
Essential KPIs for SaaS
Vital KPIs for SaaS businesses provide important insights that help track user engagement, retention, and overall financial health. Understanding these metrics can guide your marketing strategies and enhance overall performance.
- Activation Rate: This metric measures how effectively new users engage with your product post-signup. A higher activation rate often leads to improved customer retention and increased revenue.
- Churn Rate: This percentage indicates the number of customers lost over a specific period. Keeping it within a healthy range (ideally 5-7%) is crucial for assessing customer satisfaction and retention efforts.
- Monthly Recurring Revenue (MRR): MRR is essential for predicting your revenue streams. Aim for growth that outpaces losses from churn, ideally by 3.5 to 4 times.
- LTV to CAC Ratio: This ratio compares Customer Lifetime Value (LTV) to Customer Acquisition Cost (CAC). A sustainable ratio of at least 3:1 indicates effective marketing strategies and long-term profitability.
Analyzing Customer Churn

Understanding customer churn is crucial because it directly affects your business's growth and sustainability. The Customer Churn Rate indicates the percentage of customers lost over a specific period, serving as a measure of customer satisfaction. A healthy churn rate typically ranges between 5-7%. Monitoring churn metrics helps identify issues impacting your Monthly Recurring Revenue (MRR), as high churn can lead to substantial revenue losses.
Net MRR Churn offers a deeper analysis by considering revenue lost from cancellations and downgrades. Experiencing negative churn rates suggests revenue growth despite customer losses, which is a positive indicator. To mitigate churn's financial impact, focus on enhancing onboarding processes and boosting customer engagement. Actively seeking feedback enables you to address customer pain points effectively.
Implementing targeted retention initiatives is essential for improving Customer Lifetime Value (LTV). Regularly analyzing churn metrics allows you to refine your strategies, ensuring sustainable growth. Prioritizing these aspects helps create a resilient business model that not only retains customers but also fosters loyalty and enhances overall profitability.
Revenue Growth Strategies
To drive revenue growth, focus on optimizing pricing models, enhancing onboarding processes, and improving retention initiatives. These strategies are essential for maximizing customer satisfaction and minimizing churn, thereby creating a sustainable revenue stream for your business.
Optimize Pricing Models
Optimizing your pricing models can significantly boost revenue by catering to diverse customer needs and increasing engagement. Implementing effective strategies can enhance key metrics like Average Revenue Per User (ARPU) and Monthly Recurring Revenue (MRR).
Consider these four strategies:
- Tiered Pricing: Offer multiple service levels to target various customer segments, creating upselling opportunities based on usage and features.
- Usage-Based Pricing: Encourage higher user engagement by charging customers based on their actual usage, which can improve retention rates.
- Bundling Services: Combine multiple offerings into packages or provide discounts for annual plans, enhancing MRR and reducing churn.
- Competitive Pricing Analysis: Regularly monitor market trends to ensure your pricing remains attractive, maintaining a healthy Customer Lifetime Value (LTV) to Customer Acquisition Cost (CAC) ratio of at least 3:1 for sustained financial health.
Enhance Onboarding Processes
Enhancing your onboarding processes can significantly boost user engagement and retention, driving revenue growth. Optimizing these processes can substantially increase your Activation Rate, leading to better customer retention. A well-structured onboarding experience reduces Time to Value (TTV), ensuring customers quickly realize the benefits of your product, which not only improves satisfaction but also lowers churn rates.
When users clearly understand the value propositions and experience personalized onboarding, their engagement levels rise, positively impacting your Monthly Recurring Revenue (MRR) and total customer lifetime value (LTV). Implementing feedback loops during onboarding allows you to collect insights that drive continuous improvements, fostering a sense of ownership among users. This increased engagement enhances the likelihood of upselling opportunities, helping you expand your revenue streams.
Companies that streamline their onboarding processes can achieve up to a 30% reduction in churn rates. When users are equipped with the knowledge to derive value early on, they're more likely to remain loyal. Focus on refining your onboarding strategies to optimize user engagement and set the stage for sustainable growth.
Improve Retention Initiatives
Enhancing retention initiatives is crucial for driving sustainable revenue growth and ensuring long-term success in the competitive SaaS landscape. Concentrate on these strategies to bolster your retention efforts:
- Monitor Churn Rate: Consistently evaluate your churn rate and aim to keep it within a healthy range of 5-7%. This proactive approach helps identify customer satisfaction issues early, improving overall retention.
- Utilize Net Promoter Score (NPS): Leverage NPS to measure customer satisfaction and loyalty. A score above 50 signifies strong customer advocacy, which is essential for reducing churn rates.
- Boost Customer Engagement: Create feedback loops and regularly update your product to enhance customer engagement. Engaged customers exhibit higher activation rates, contributing to decreased churn.
- Expand Existing Accounts: Focus on upselling and cross-selling to increase expansion Monthly Recurring Revenue (MRR). This strategy helps offset revenue loss from churn while promoting sustainable growth.
LTV to CAC Ratio

Understanding the LTV to CAC ratio is fundamental for evaluating how effectively you're acquiring customers relative to the revenue they generate over time. This ratio compares Customer Lifetime Value (LTV) to Customer Acquisition Cost (CAC). A healthy LTV to CAC ratio is typically around 3:1, indicating that the revenue from a customer should be three times what it costs to acquire them.
To calculate LTV, you divide the Average Revenue Per Account (ARPA) by the Customer Churn Rate, revealing the total revenue expected from a customer during their relationship with your SaaS business. On the other hand, CAC is determined by dividing total sales and marketing expenses by the number of new customers acquired, showcasing the efficiency of your marketing efforts.
Regularly monitoring the LTV to CAC ratio is vital for evaluating the sustainability of your business model. It informs your marketing investment decisions and helps guarantee profitability. If your ratio falls below the ideal threshold, it might be time to reevaluate your customer acquisition strategies or improve retention initiatives to enhance LTV.
Calculating Average Revenue Per User
Calculating Average Revenue Per User (ARPU) is crucial for understanding the revenue each active customer brings to your SaaS business. This metric offers insights into your revenue strategy and customer value, allowing for effective assessment of your financial health.
To calculate ARPU, divide your Monthly Recurring Revenue (MRR) by the number of active customers.
Here's a step-by-step guide to understanding ARPU:
- Identify MRR: Calculate your Monthly Recurring Revenue, including all subscription fees.
- Count Active Customers: Determine the total number of active customers using your service.
- Perform the Calculation: Divide MRR by the number of active customers to find your ARPU.
- Monitor Trends: Track ARPU over time to evaluate customer retention and upselling effectiveness.
A high ARPU typically indicates a strong product-market fit and high customer satisfaction, which can drive sustainable growth.
Importance of Activation Rate

The Activation Rate is a crucial metric that measures how effectively users engage with the key features of your product shortly after signing up. A high Activation Rate signifies that your onboarding process is successful, enabling users to quickly understand and appreciate the value of your product. Early recognition of this value increases the likelihood of user retention, contributing to sustained revenue growth.
To calculate your Activation Rate, divide the number of users who complete essential activation actions by the total number of signups, then multiply by 100. Regularly monitoring this metric helps identify trends and informs data-driven decisions, enhancing user satisfaction and promoting long-term engagement.
Investing in an effective onboarding process can significantly boost your Activation Rate, driving overall growth. When users comprehend how to use your product efficiently from the outset, they're more likely to explore its full range of features. This not only enhances their experience but also maximizes the value your product delivers.
In the competitive SaaS market, prioritizing Activation Rate is essential for sustainable success.
Measuring Customer Satisfaction
When measuring customer satisfaction, the Net Promoter Score (NPS) is an essential metric. It assesses loyalty by comparing promoters and detractors, where a high score often indicates strong retention rates. Additionally, monitoring engagement metrics such as Daily Active Users (DAU) provides valuable insights into customer satisfaction levels.
Importance of NPS
Measuring your Net Promoter Score (NPS) is crucial for understanding customer satisfaction and loyalty. NPS provides clear insights into customer perceptions of your product and brand, directly affecting customer loyalty. By monitoring this metric, you can pinpoint areas for product enhancement and refine customer retention strategies.
Here are four reasons why NPS is critical:
- Customer Advocacy: A high NPS signifies strong customer advocacy, leading to organic growth through word-of-mouth referrals.
- Churn Rates: Regular NPS measurement helps identify trends in customer sentiment, enabling you to address potential issues before they result in customer churn.
- Customer Lifetime Value (CLV): Companies focusing on improving NPS often see increased CLV, as satisfied customers are more likely to make repeat purchases.
- Actionable Insights: NPS provides a straightforward metric reflecting customer sentiments, helping you prioritize actions to enhance their experience.
Engagement Metrics Analysis
Measuring engagement metrics such as Daily Active Users (DAU) and Monthly Active Users (MAU) provides valuable insights into customer satisfaction and loyalty. High DAU and MAU generally indicate robust customer engagement, which is often associated with lower churn rates. Companies implementing effective engagement strategies typically experience churn rates below the industry average of 5-10%.
Analyzing these metrics enables you to identify trends in user behavior, allowing for timely adjustments to user onboarding processes. This helps users derive value quickly, enhancing overall satisfaction and improving retention rates. Additionally, tracking the Customer Engagement Score can identify areas for product improvement, enabling you to refine features that matter most to your customers.
Focusing on engagement can also significantly enhance your Net Promoter Score (NPS), a key indicator of customer loyalty and the likelihood of referrals. Implementing personalized communication and targeted feature updates can further increase customer satisfaction, fostering a more loyal user base.
Retention Rate Insights
Understanding retention rates is crucial for evaluating customer satisfaction and the effectiveness of your SaaS offering. A high retention rate not only signifies strong customer engagement but also positively impacts your customer lifetime value (LTV) and long-term revenue.
To improve retention strategies, consider these key factors:
- Onboarding Processes: Ensure your onboarding is smooth and informative to set the right expectations and demonstrate product value from the start.
- Customer Support: Provide timely and effective customer support to address issues promptly and maintain trust.
- Monitoring Retention Rates: Regularly track retention rates to identify trends and address potential issues before they escalate.
- Product Value: Continuously assess and enhance your product to meet evolving customer needs and boost satisfaction.
A retention rate above 90% is excellent, while rates below 80% might indicate challenges with product value or customer support.
Conclusion
In conclusion, mastering key SaaS metrics is crucial for your growth and sustainability. By closely monitoring Customer Acquisition Cost (CAC), Lifetime Value (LTV), churn rates, and other Key Performance Indicators (KPIs), you can make data-driven decisions that propel your business forward.
A healthy LTV-to-CAC ratio and high activation rates reflect effective strategies. Prioritizing customer satisfaction won't only enhance retention but also build loyalty, ensuring your SaaS venture thrives in a competitive market.
Related posts